The Problem: AI Workloads Don't Live in One Process
Modern AI applications bounce between high-level frameworks, native CPU code, and GPU kernels. When a bug crosses those boundaries, you need to see the host and the device together — and that's much harder than attaching a conventional debugger to another process.
A CPU thread has a familiar register context. A GPU may execute groups of lanes in lockstep, expose thousands of execution lanes, and use completely different instruction sets and address spaces. The same address like 0x1000 can point to different locations on CPU and GPU. Traditional debugger models assume one process, one architecture, one memory map — GPU programs break every one of those assumptions.
GPU vendors historically built device-specific debuggers (AMD's ROCgdb, NVIDIA's CUDA-GDB). They work, but common debugger capabilities get reimplemented and maintained separately for each platform. Meta's team took a different path for LLDB: a common accelerator plugin architecture in lldb-server that keeps the shared debugger vendor-neutral while giving hardware vendors a focused place to plug in device-specific behavior.
For the full technical breakdown, see the original engineering post.
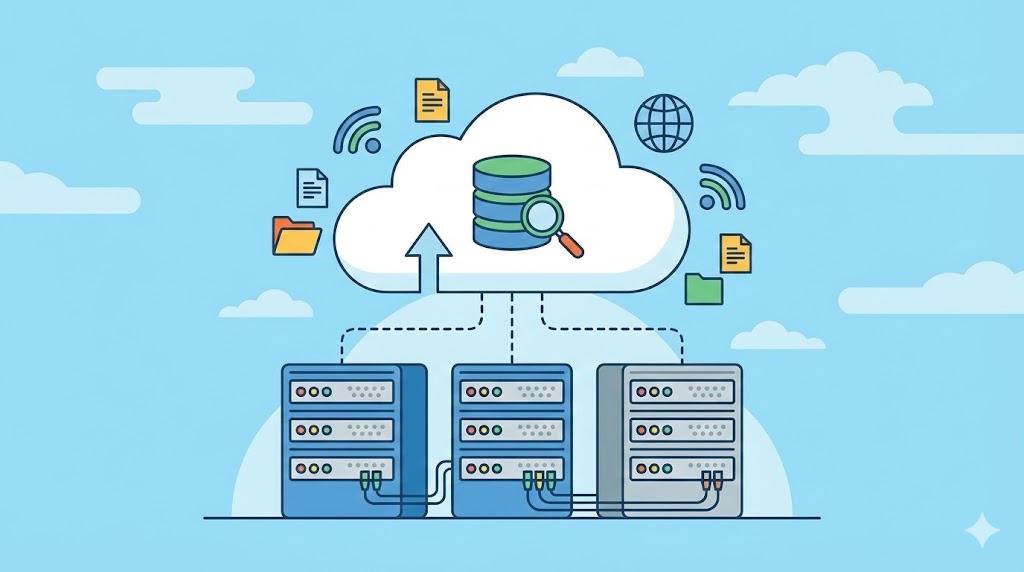
Two Targets, One Session
The core design decision: represent the CPU and the accelerator as separate LLDB targets, each with its own architecture, threads, registers, address space, and execution state.
The CPU keeps using LLDB's established native debugging path. When the accelerator becomes available, the plugin provides a second connection that LLDB uses to create the device target. To the debugger, the two targets are technically independent. To you, they appear in one LLDB or IDE session.
How a session flows
- LLDB connects to
lldb-serverand discovers available accelerator plugins. - A plugin asks LLDB to set internal breakpoints in the host process — these mark runtime events like "GPU debugging can begin now."
- When the host hits one of those points,
lldb-servernotifies the plugin, which initializes the vendor debugging API and prepares a device endpoint. - LLDB creates a second target for the accelerator and connects. Device threads, registers, memory, modules, and breakpoints all reuse LLDB's existing abstractions.
Structured actions coordinate the two sides: a plugin can request CPU breakpoints, hand back connection info, report device modules, and sync host/device execution — all without leaking vendor-specific API details to the LLDB client.
# Conceptual flow (pseudo-code, not the actual LLDB API)
# LLDB client side
server = lldb_server.connect()
plugins = server.discover_accelerator_plugins()

if 'mock_gpu' in plugins:
    # Ask the plugin to place a host breakpoint at runtime init
    server.request_breakpoint(plugin='mock_gpu', event='gpu_runtime_ready')

# When host hits the breakpoint, server notifies plugin,
# plugin spins up device endpoint, LLDB attaches a second target.
device_target = server.acquire_accelerator_target('mock_gpu')
device_target.breakpoint_set(file='kernel.hip', line=42)
A mock accelerator plugin ships alongside the framework so the LLVM test suite can verify discovery, breakpoint coordination, connection creation, and basic device state — all without specialized hardware. That's what makes the shared infrastructure reviewable and testable independently of any particular GPU.

What This Buys You (and What It Doesn't)
Strengths
- Vendor neutrality at the client layer. CLI improvements, remote protocol changes, symbol handling, and IDE integration benefit every accelerator at once.
- Clean separation of concerns. Vendors own their hardware quirks; the LLDB project owns the debugger UX.
- No overhead for CPU-only apps. The accelerator path activates only when the debugged application uses a supported GPU runtime. Pure CPU debugging stays on the existing native path.
- Postmortem support. GPU core-dump plugins share a common base class; vendor implementations supply device-specific thread, register, memory, and module state.
- Heterogeneous fleet validation. Meta runs GPUs from multiple vendors with different stacks, and the same model works across all of them — a strong signal the abstraction holds.
Limitations to keep in mind
- Still mid-upstream. Most of the common framework is in LLVM (plugin interface, GDB-remote packets for discovery/init/coordination, multi-address-space support, mock tests), but some pieces are pending. Don't expect turnkey support for every GPU tomorrow.
- Vendor backends are the hard part. The framework gives you a place to plug in; it doesn't write the device backend for you. Quality still depends on each vendor's implementation.
- Not a replacement for profilers. This is a debugger architecture, not a performance tool. For kernel-level perf work you still want Nsight, ROCprof, or similar.
- Two-target mental model. You now have two independent targets in one session. That's cleaner than one artificial merged process, but it does mean you need to be explicit about which target a command applies to.
If you're coming from a Node.js background and juggling runtime deprecations on the deployment side, this Vercel Node.js 20 migration playbook is a useful parallel read on managing platform transitions without breaking production.

Where to Go Next
If you maintain a debugger integration, a GPU runtime, or an IDE frontend, the practical next steps are:
- Read the upstreamed RFCs and PRs in the LLVM repo — the plugin interface and GDB-remote packet definitions are the contract you'll code against.
- Build against the mock accelerator plugin first. It exercises the full discovery → breakpoint → connection → device-state flow without needing hardware, so you can validate your integration logic early.
- Keep the CPU path untouched. The architecture's biggest win is that CPU-only debugging incurs no overhead — don't regress that when adding your backend.
- Watch for the remaining upstream pieces before committing to production tooling; the framework is stabilizing but not frozen.
For frontend folks who also care about layout correctness while building debug UIs, the CSS translate() complete guide is a good companion for the visualization side of these tools.
The bigger takeaway: the "one process, one architecture" assumption baked into most debuggers is a poor fit for heterogeneous compute. Treating CPU and GPU as peer targets with a shared protocol between them is a cleaner abstraction — and it's the kind of design that scales as more accelerator types (NPUs, custom ASICs) enter the picture.